Bringing OpenClaw Conversations into Azure AI Foundry Tracing
Once I had OpenClaw (an open-source multi-channel chat agent gateway) running across Telegram, LINE, and WhatsApp, the hard part was no longer whether the service was up. The harder question was: what did the agent actually see before it answered like that? This post, the next instalment in the OpenClaw on Azure series, is about wiring OpenClaw Gateway conversations, model calls, tool calls, token usage, and multimodal content into Azure AI Foundry Tracing. The goal was simple: when something looks odd, I do not want to guess.
What I like about Azure AI Foundry Tracing is that it stops the debugging session from becoming a scavenger hunt across logs, tool output, model responses, and token counters. The useful clues sit in one place. For agent work, that is more useful than another dashboard to check, because I can follow the point where a turn started to drift.
It also turned out to be a good foundation for evaluation. After a fixed test conversation runs, I do not only want to know whether the agent replied. I want to know what the model saw, which tools it used, and what content came out at the end. The trace makes stability something I can rerun and compare, not something I describe with a vague "this version feels better".
This post explains how OpenClaw sends model calls, tool calls, token usage, and redacted multimodal content into Azure AI Foundry Tracing. It also shows how I use those traces as evidence for repeatable agent evaluation.
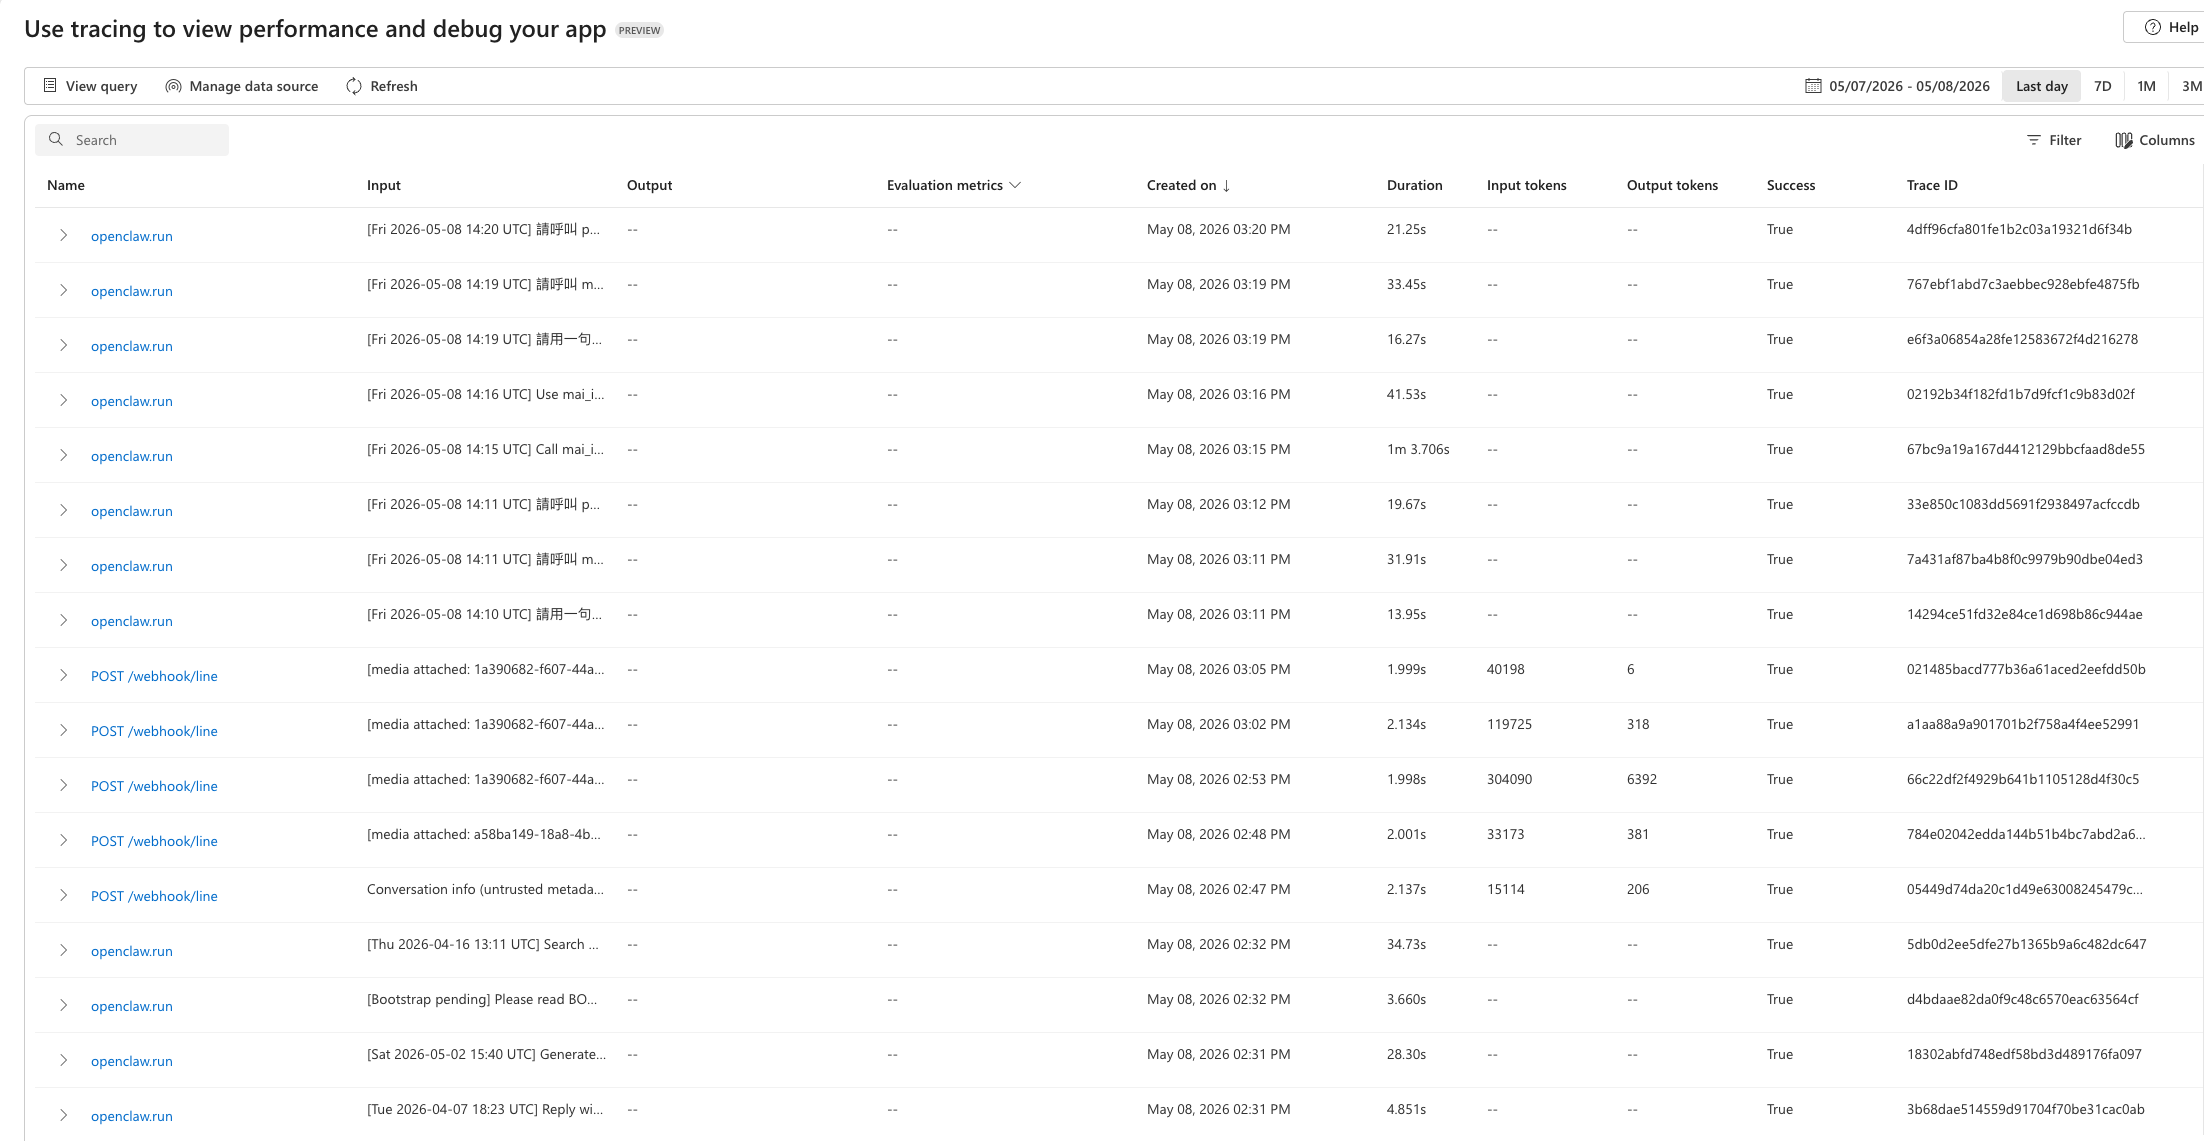
The Azure AI Foundry Tracing tab lists each OpenClaw execution as a trace. Real LINE webhook traffic shows token usage in the trace list; CLI-driven evaluation traces may not, because they do not enter through an HTTP webhook root.
Result First
Once the integration was in place, a real user message stopped being a flat log line. It became a trace I could expand:
POST /webhook/line or POST /webhook/telegram
└─ openclaw.message_processed
   └─ openclaw.run
      ├─ openclaw.context.assembled
      ├─ openclaw.model.call
      ├─ openclaw.tool.execution
      └─ chat.completions gpt-5dot4
The things I check most often are straightforward:
- what the user actually sent
- what the model returned
- which tools were called, such as image generation, PDF publishing, search, or speech-to-text
- how many input and output tokens each model call used
- whether the same Telegram, LINE, or WhatsApp conversation is grouped into one conversation timeline
- whether multimodal content, especially images, was redacted instead of being written into telemetry as base64
I did not want to rely on a few screenshots and say "that looks about right". I also built a repeatable validation flow: run three fixed conversations on the live VM, then query Application Insights for the corresponding model-call traces. On 2026-05-08, the run finished with 3/3 PASS. The plain text, image generation, and PDF publishing scenarios were all visible and inspectable in Foundry Tracing.
This is where tracing starts to connect with evaluation. The evaluation defines the work the agent should keep doing reliably. The trace records the evidence from each run. When the model, prompt, plugin, or toolchain changes later, I can compare the prompt, tool calls, completion, and token usage instead of waiting for someone to say "it feels strange today".
I started with three small scenarios that still touch the important surfaces:
| Scenario | User message | What it proves |
|---|---|---|
text-001 |
Ask for a one-sentence description of Taipei weather. | Plain text prompt and completion are readable, with gen_ai.provider.name, gen_ai.operation.name, and gen_ai.conversation.id. |
image-gen-001 |
Ask mai_image_generate to draw a warm family living room. |
The image result comes back as a Blob URL, the trace has openclaw.content.image.0.redacted=true, and there is no data: URL or base64 payload. |
pdf-publish-001 |
Ask publish_file to generate a family memo PDF. |
The final download link appears in gen_ai.completion.0.content, so the user-visible artefact can be replayed and audited. |
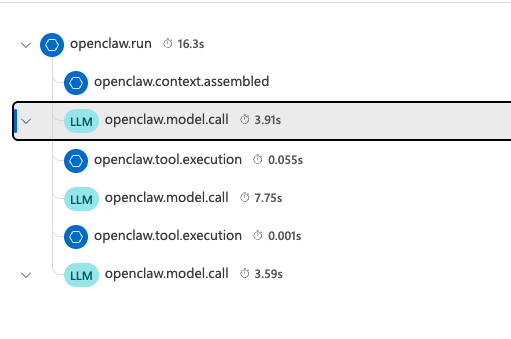
Expanding a single openclaw.run shows the steps inside one agent turn: context assembly, model calls, tool execution, and the final model response.
Related OpenClaw Articles
This post makes more sense if you have seen the earlier OpenClaw build notes:
- Foundation: Building a Family AI Chat Bot on Azure with OpenClaw.
- Image generation: Teaching OpenClaw to Draw with MAI-Image-2.
- Speech-to-text: Teaching OpenClaw to Understand Voice with MAI-Transcribe-1.
- Long-running tools and plugins: Building a Natural-Language Reminder & Scheduled Task System for OpenClaw.
Why OpenClaw Needed This
Once a family assistant starts receiving group chats and direct messages, traditional logs become a poor way to understand behaviour.
The user may only see this:
Download link:
https://...blob.core.windows.net/documents/.../family-memo.pdf
But as the operator, I usually want to know something else:
- Who triggered this turn? Telegram, LINE, or WhatsApp?
- What was in the full prompt? Did the previous conversation leak into this turn?
- Why did the model decide to call
publish_file? - Did the tool succeed, and where was the time spent?
- Did the final reply actually include the PDF the user asked for?
- If the message had an image, did the trace keep the raw image bytes?
Application logs can answer some of this, but they are too flat. I have to stitch together timestamps, session IDs, and request IDs myself, and even then it is easy to miss which earlier step affected the final reply.
Tracing helps by putting the turn back into order. I can follow the data the system assembled, the model decision, the tool call, the tool result, and the next model response in one line of evidence. That matters for AI assistants because many failures are not one obvious failed step. They are the result of context and decisions accumulating over a turn.
Architecture: From Webhook to Foundry
The flow is easier to explain as a diagram first:
flowchart TD
   channels["Telegram / LINE / WhatsApp"]
   webhook["HTTPS webhook"]
   gateway["OpenClaw Gateway<br/>on Azure VM"]

   diag["diagnostics-otel plugin"]
   foundry["openclaw-foundry-integration plugin"]
   monitor["@azure/monitor-opentelemetry preload"]

   core["openclaw.* spans"]
   enrichment["chat.completions / execute_tool<br/>enrichment spans"]
   appi["Application Insights / Log Analytics"]
   portal["Azure AI Foundry<br/>Project Tracing tab"]

    channels --> webhook --> gateway
    gateway --> diag --> core --> monitor
    gateway --> foundry --> enrichment --> monitor
    monitor --> appi --> portal
There are two plugins doing different jobs:
diagnostics-otelis OpenClaw's built-in diagnostics plugin. It emits the trusted core spans such asopenclaw.run,openclaw.model.call, andopenclaw.tool.execution.openclaw-foundry-integrationis the Foundry enrichment plugin I wrote. It adds the OpenTelemetry GenAI semantic conventions the Foundry portal needs, includinggen_ai.conversation.id,gen_ai.provider.name,gen_ai.operation.name, prompt and completion content, tool I/O, and token usage.
Both plugins follow the same extension model that powered a reminder plugin built on the same OpenClaw runtime, so the diagnostics surface stays consistent across long-running tools.
For export, I did not run an OTel Collector. I used @azure/monitor-opentelemetry as a preload:
Environment=APPLICATIONINSIGHTS_CONNECTION_STRING=<from-key-vault>
Environment="NODE_OPTIONS=--require /opt/openclaw/appinsights-setup.js"
Environment=OPENCLAW_OTEL_PRELOADED=1
Environment=OTEL_SERVICE_NAME=openclaw-gateway
Environment=OTEL_SEMCONV_STABILITY_OPT_IN=gen_ai_latest_experimental
The part that tripped me up at first was treating "creating OpenTelemetry spans" and "sending data into Application Insights" as the same thing. OpenClaw plugins create OTel spans, but an Application Insights resource is not an OTLP receiver that I can point an endpoint at directly.
flowchart TD
   openclaw["OpenClaw Gateway"]
   spans["OpenClaw plugins<br/>create OTel spans"]

   direct["Direct OTLP endpoint<br/>to Application Insights"]
   preload["Chosen path:<br/>Azure Monitor SDK preload"]
   collector["Alternative path:<br/>run an OTel Collector"]

   exporter["Azure Monitor<br/>OpenTelemetry Exporter"]
   connection["Application Insights<br/>connection string"]
   appi["Application Insights"]
   foundry["Azure AI Foundry<br/>Tracing tab"]

   openclaw --> spans
   spans -. "not the path used" .-> direct
   spans --> preload --> exporter --> connection --> appi --> foundry
   spans -. "heavier option" .-> collector --> exporter

   classDef blocked fill:#fff1f2,stroke:#be123c,color:#7f1d1d
   classDef chosen fill:#ecfdf5,stroke:#047857,color:#064e3b
   class direct blocked
   class preload,exporter,connection,appi,foundry chosen
I chose the preload route for a fairly ordinary reason. Microsoft's OpenTelemetry guidance uses the Azure Monitor OpenTelemetry Distro with an Application Insights connection string. The OTLP Exporter documentation describes sending telemetry to an extra OTLP receiver, such as a Collector. For this deployment, adding a collector container would have meant one more thing to operate, so I let the Azure Monitor SDK register the global OTel SDK before the Node.js process started, then had the OpenClaw plugins write spans into that SDK.
There are still operational details around Key Vault, systemd drop-ins, and VM upgrades. I am leaving those out here so the article can stay focused on the tracing architecture and the bits that were easy to get wrong.
The Awkward Part: Foundry Does Not Read the Span You Expect
At the start, I thought the job would be simple: write a plugin, find the active span during a model call, and add gen_ai.conversation.id plus prompt and completion content.
That was not how it worked.
The first issue was that OpenClaw's diagnostics-otel plugin does not use the usual withSpan(callback) pattern to make the model-call span active. From a sibling plugin, trace.getActiveSpan() did not give me the openclaw.model.call span I wanted to enrich.
The second issue mattered more. Azure AI Foundry's Input / Output panel mainly reads the trusted openclaw.model.call span. That span belongs to diagnostics-otel, and an external plugin cannot simply write attributes into it. OpenClaw keeps that span behind an internal diagnostics capability, and that capability is only granted to bundled plugins.
The result was a two-layer design:
openclaw-foundry-integrationemits its ownchat.completions <model>spans with full GenAI metadata, which can be queried with KQL and used in evaluation gates.oc bundle-diagnostics-otelmovesdiagnostics-otelinto OpenClaw's stock extensions directory so it can use the internal diagnostics capability, then applies a local patch that writes prompt and completion content, plus legacy GenAI content events, back onto the trustedopenclaw.model.callspan.
That patch is not the neatest possible answer, but it is the smallest production workaround I found. I added three safeguards:
- Fail loud: if the patch anchor is missing, the command stops instead of half-applying the change.
- Idempotent: rerunning it on the same version reports that the patch is already applied.
- Version-aware: when the patch version changes, the old block is removed before the new one is inserted.
Long term, the better fix is for OpenClaw to support these GenAI content attributes and events upstream, or to bundle diagnostics-otel into dist/extensions/ officially. Until then, the local patch is the bridge that makes the Foundry portal's Input / Output view useful.
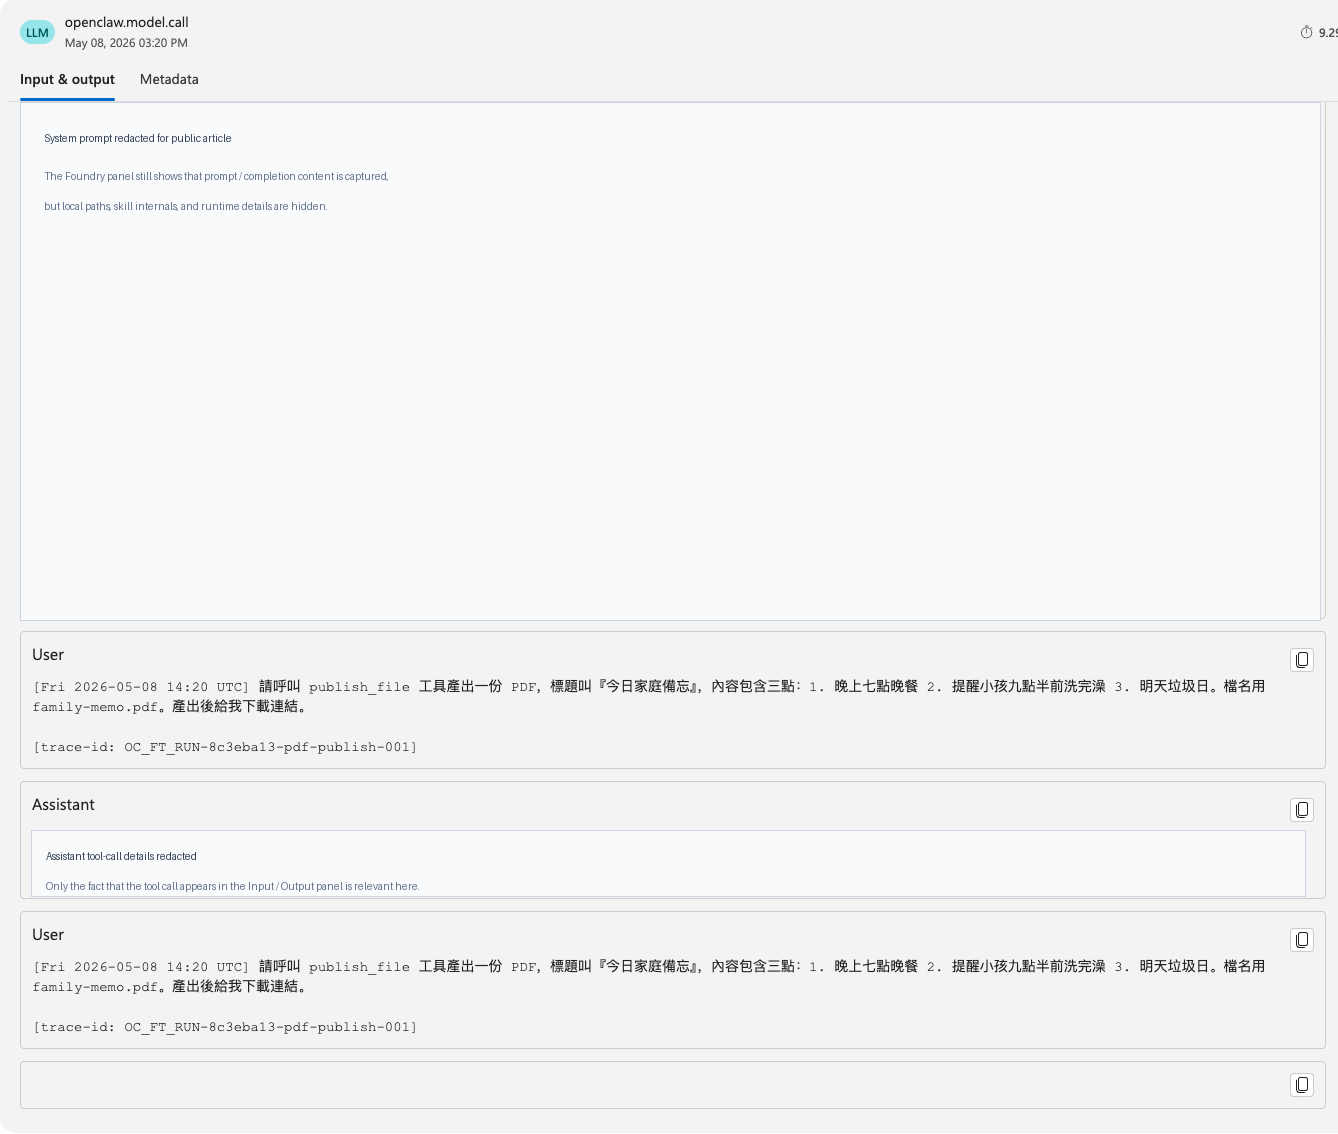
After the trusted span content was patched, the openclaw.model.call Input & Output panel was no longer blank. This screenshot keeps the useful Foundry UI evidence visible while redacting local paths and tool-call details that do not belong in a public article.
Multimodal Content: Readable Traces, No Image Bytes
I was deliberately conservative with multimodal content. When images enter a trace, I only keep a readable summary and metadata. I do not keep raw bytes.
An image can appear in a model or tool payload like this:
{
  "type": "image_url",
  "image_url": {
    "url": "data:image/png;base64,iVBORw0KGgo..."
  }
}
Writing that directly into a trace causes two problems:
- It is unreadable: the Foundry Input panel gets buried under a long base64 string.
- It raises privacy risk: the image may contain family members, a home, a document, or something else sensitive.
The content normaliser now turns image content into a deterministic placeholder:
[image: image/png, id=889444bc-2de3-4f7d-a28b-f08d835bab29, redacted]
In the 2026-05-08 smoke test the image-gen scenario produced a 1.37 MB PNG (1,370,376 bytes) that the trace kept only as redacted metadata on the span:
gen_ai.input.images_count = 1
openclaw.content.image_count = 1
openclaw.content.image.0.mime_type = image/png
openclaw.content.image.0.bytes = 1370376
openclaw.content.image.0.redacted = true
That is enough to see that there was an image, how large it was, and whether it was redacted, without leaving the image itself in telemetry.
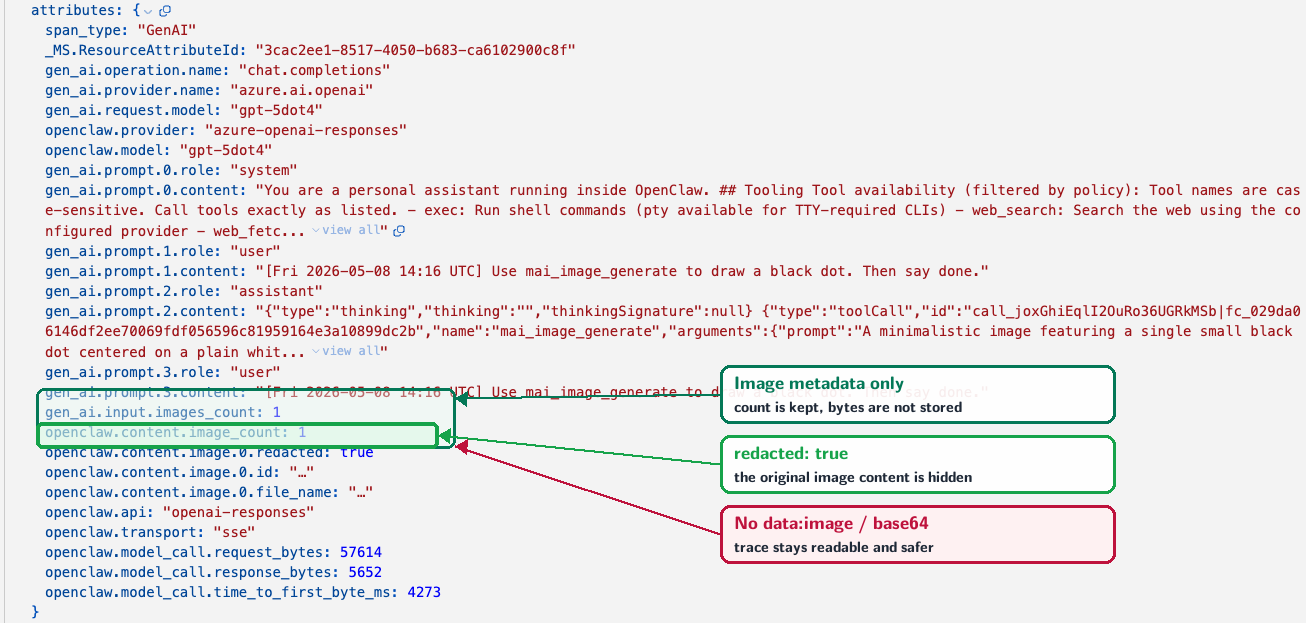
The trace keeps image metadata such as gen_ai.input.images_count and openclaw.content.image_count, while openclaw.content.image.0.redacted: true confirms that the raw content was hidden. There is no data:image payload or long base64 string in the view.
Three Repeatable Conversation Checks
I did not want to look at the portal once and call it done, so I added an evaluator: oc eval foundry-trace.
It does six things:
- Sends three fixed scenarios to
openclaw agent --jsonon the live VM. - Adds a harmless sentinel to each prompt, such as
OC_FT_RUN-8c3eba13-image-gen-001. - Waits for Application Insights ingestion.
- Queries the
chat.completionsenrichment spans with KQL and requires the sentinel in the prompt content. - Checks whether each scenario produced the expected signals.
- Writes both a blog-friendly Markdown report and a machine-readable JSONL file.
Example 1: Plain Text
Describe today's weather in Taipei in one sentence, and keep it short.
Example reply:
Mild and cloudy in Taipei today.
This checks the cleanest case: both prompt and completion are plain text, and the span should include attributes such as:
gen_ai.provider.name = azure.ai.openai
gen_ai.operation.name = chat.completions
gen_ai.request.model = gpt-5dot4
gen_ai.conversation.id = oc-60ade8193223dd14
gen_ai.usage.input_tokens = 831
gen_ai.usage.output_tokens = 621
Example 2: Image Generation
Call the mai_image_generate tool and draw a warm family living room at dinner time, with soft lighting and soup on the table. After the image is ready, describe it in one sentence.
The reply contains a public Blob URL and a short description:
https://...blob.core.windows.net/images/...png

I created a warm family living room scene at dinner time, with soft lighting, soup, and home-cooked food on the table.
The important part is not just whether an image was produced. The trace must prove that the image content was redacted:
openclaw.content.image.0.mime_type = image/png
openclaw.content.image.0.bytes = 1370376
openclaw.content.image.0.redacted = true
Example 3: PDF Publishing
Call publish_file and create a PDF titled "Family Memo". Include three points: dinner at 7 pm, remind the children to shower before 9:30 pm, and rubbish collection tomorrow. Use the filename family-memo.pdf and give me the download link.
The reply includes the artefact link:
Download link:
https://...blob.core.windows.net/documents/.../family-memo.pdf
This checks whether the final user-visible artefact is present in the trace:
gen_ai.completion.0.content = Download link: https://...family-memo.pdf
All three checks passed. The screenshots in this article come from the same tracing pipeline in the Foundry portal.
A Small Portal Quirk: Empty Token Columns
In the Foundry trace list, some rows have Input tokens and Output tokens, while others show blanks. That does not mean the token data disappeared. It is a roll-up behaviour in the portal.
A real webhook trace usually looks like this:
POST /webhook/line
└─ openclaw.message_processed
   └─ openclaw.model.usage
The Foundry portal rolls child openclaw.model.usage token usage up to the HTTP request root, so the POST /webhook/line row shows input and output token counts.
The evaluator calls the OpenClaw CLI directly on the VM:
openclaw.run
└─ openclaw.model.usage
For this non-HTTP root, the portal does not roll token columns up in the same way. The openclaw.run row may show blanks, even though the data is still present:
openclaw.model.usagehasgen_ai.usage.input_tokensandgen_ai.usage.output_tokens.chat.completions <model>enrichment spans also carry the same attributes.
For screenshots, I use real Telegram or LINE webhook traces. For repeatable checks, I use the evaluation report.
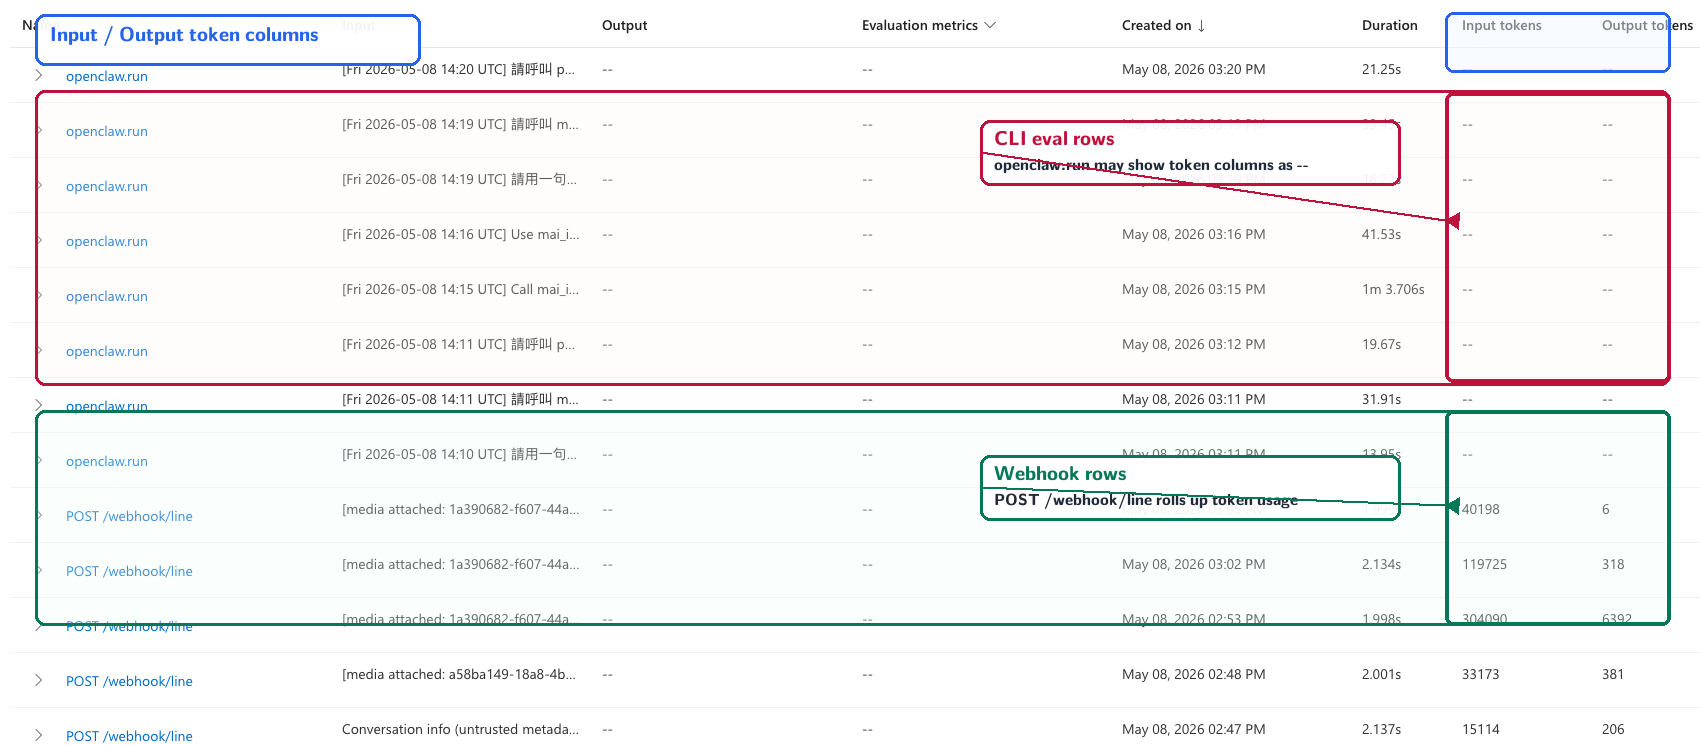
The trace list shows both behaviours: CLI eval rows such as openclaw.run may show -- in the token columns, while real webhook rows such as POST /webhook/line show token numbers. The token data is still present; the portal roll-up differs by root span type.
Rollout Order
The rollout order matters because OpenClaw treats plugin configuration as fail-closed. If the config references a plugin that is not installed yet, the gateway refuses to start.
My internal CLI flow looks roughly like this. I am using <gateway-host> as a placeholder for the real OpenClaw Gateway host:
# 1. Install the Foundry enrichment plugin
uv run oc install-foundry-plugin <gateway-host>

# 2. Configure the Azure Monitor preload
uv run oc setup-appinsights <gateway-host>

# 3. Deploy openclaw.json with diagnostics.otel and the plugin allow-list enabled
uv run oc deploy-config <gateway-host>

# 4. Move diagnostics-otel into stock extensions and apply the Foundry content patch
uv run oc bundle-diagnostics-otel <gateway-host>

# 5. Verify
uv run oc verify-foundry-plugin <gateway-host>
uv run oc smoke-test <gateway-host> --extended
uv run oc eval foundry-trace <gateway-host>
Step 4 is the unusual one. After every oc upgrade, I have to rerun oc bundle-diagnostics-otel, because the OpenClaw npm upgrade rebuilds the bundled plugin directory. I put that into the upgrade flow so the next version bump does not quietly make tracing go blank.
Privacy, Cost, and Retention
This tracing setup captures prompt, completion, and tool I/O content. That is a deliberate choice, not a safe default.
For my family deployment, I chose to enable content capture because:
- when someone asks "why did it answer like that?", input and output content are often necessary for debugging
- telemetry stays in my own Azure subscription, backed by my own Log Analytics workspace
- retention is 30 days, after which the data is deleted automatically
- image bytes are not written into traces; only redacted placeholders and metadata are kept
- the volume is small enough for a family assistant to sit well below typical Application Insights and Log Analytics free allowances
I would not copy this policy blindly. For customer support, healthcare, finance, or any high-sensitivity workflow, I would use a more conservative captureContent policy, or only enable full content capture in staging or short debug sessions.
What This Actually Added
After this work, OpenClaw did not just have more logs. It had a replayable record of agent execution.
The useful change was not that the Foundry portal looked nicer. It was that I could finally answer these questions:
- Which timeline does this conversation belong to? Check
gen_ai.conversation.id. - Was this really a chat completion? Check the
chat.completionssemantic span. - Did a tool call happen? It is now a node in the trace tree, not a line buried in text logs.
- Was multimodal content redacted before it entered telemetry? The span attributes say so.
- Did a scenario still pass after a model or prompt change? Run
oc eval foundry-traceagain.
Family assistants fail in quiet ways. A form of address, an image, a bit of earlier context, or a tool result can all change what the agent decides to do. With tracing in place, I can at least unfold the decision and decide whether the fix belongs in the prompt, the plugin, or a new evaluation case.